DCT Local Wifi: Difference between revisions
From EMIT Controls
(Created page with "==Overview== The Dynamic Control Touchscreen (DCT) features a local Wifi connection that can be connected to with a phone to view current runtime information. This allows viewing sensor data from around the site. ==How to Connect== #On your phone, check under WiFi connections for an access point named “EMIT_XXXX”, where XXXX is the serial number of the touchscreen. #Select the connection, and for the password enter “emitemit” (all lowercase). It is recommende...") |
No edit summary |
||
| Line 10: | Line 10: | ||
[[File:Dct-wifi.png]] | [[File:Dct-wifi.png]] | ||
==Pages== | |||
===Dashboard=== | |||
The dashboard page shows the current reading of various standard inputs. | |||
===Brain AI/ TC=== | |||
This page shows the current readings of analog inputs and thermocouples connected to the Brain and any expansion modules | |||
[[File:Dct wifi brain AITC.png|500px]] | |||
===Digital Inputs=== | |||
This page shows the current status of the digital inputs and switches | |||
[[File:Dct wifi di.png|500px]] | |||
===Digital Outputs=== | |||
This page shows the current state of the digital outputs, and contains test buttons for forcing outputs on and off. Note that the test will not work if the unit is running. | |||
[[File:Dct wifi do.png|500px]] | |||
===Downloads=== | |||
This page allows for downloading datalogs and configs to the computer or phone. | |||
[[File:Dct wifi downloads.png|500px]] | |||
Latest revision as of 21:36, 12 August 2024
Overview
The Dynamic Control Touchscreen (DCT) features a local Wifi connection that can be connected to with a phone to view current runtime information. This allows viewing sensor data from around the site.
How to Connect
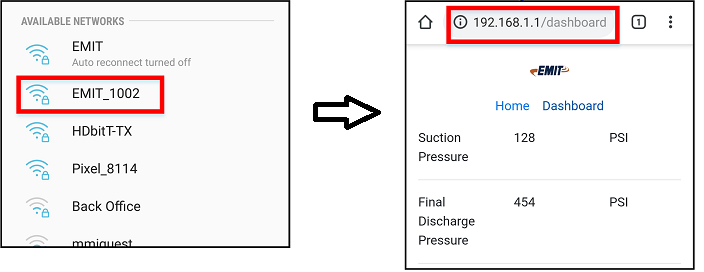
- On your phone, check under WiFi connections for an access point named “EMIT_XXXX”, where XXXX is the serial number of the touchscreen.
- Select the connection, and for the password enter “emitemit” (all lowercase). It is recommended to turn auto reconnect off.
- On your phone browser, enter “192.168.1.1” into the navigation bar. It should pull up the page shown below, where “Dashboard” can be selected to see current unit data. If it does not connect, try entering “http://192.168.1.1” into the navigation bar of the browser.
Pages
Dashboard
The dashboard page shows the current reading of various standard inputs.
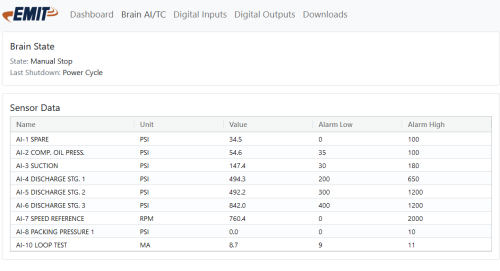
Brain AI/ TC
This page shows the current readings of analog inputs and thermocouples connected to the Brain and any expansion modules
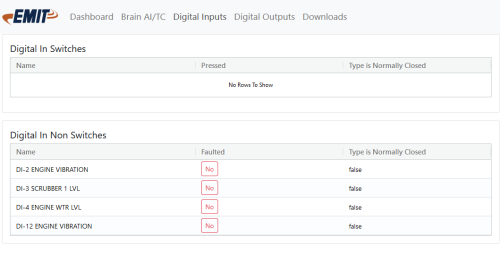
Digital Inputs
This page shows the current status of the digital inputs and switches
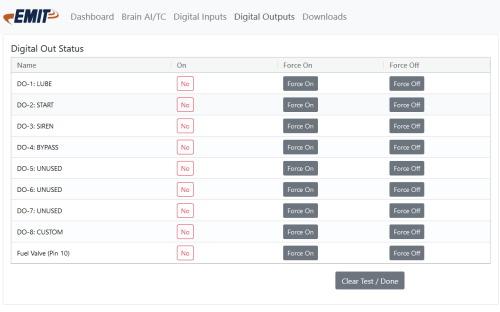
Digital Outputs
This page shows the current state of the digital outputs, and contains test buttons for forcing outputs on and off. Note that the test will not work if the unit is running.
Downloads
This page allows for downloading datalogs and configs to the computer or phone.


