EDR Wi-Fi Console: Difference between revisions
m (Thomas Peterson moved page EDR Wi-Fi Console Pages to EDR Wi-Fi Console) |
No edit summary |
||
| Line 1: | Line 1: | ||
== Overview == | |||
The EDR has a configuration and status page that can be viewed using a phone or computer by connecting to the device over WiFi. This console generally is used on installation to make sure data is collected correctly, or for debugging. | |||
=== Connecting === | |||
Check your target device’s Wi-Fi settings for a network called “EDR_xxxx”, where xxxx is the serial number of the Data Relay. Connect to this network and enter the password ‘emitemit’. | |||
Note: There will be no internet access while you are connected to the network. It is recommended that you turn auto reconnect off. | |||
Once connected, open a web browser and type http://172.16.16.1/ . This will bring up the Data Relay console. | |||
[[File:Capture.png]] | |||
== Wifi Console Pages == | |||
From the top right menu on a phone, or along the top on a computer, there will be the following page categories: Status, Compressor Master, Alerts, Engine Data Translator, Modbus Slave, and Debug. Each of these 6 pages are detailed below. | From the top right menu on a phone, or along the top on a computer, there will be the following page categories: Status, Compressor Master, Alerts, Engine Data Translator, Modbus Slave, and Debug. Each of these 6 pages are detailed below. | ||
Latest revision as of 16:22, 29 July 2022
Overview
The EDR has a configuration and status page that can be viewed using a phone or computer by connecting to the device over WiFi. This console generally is used on installation to make sure data is collected correctly, or for debugging.
Connecting
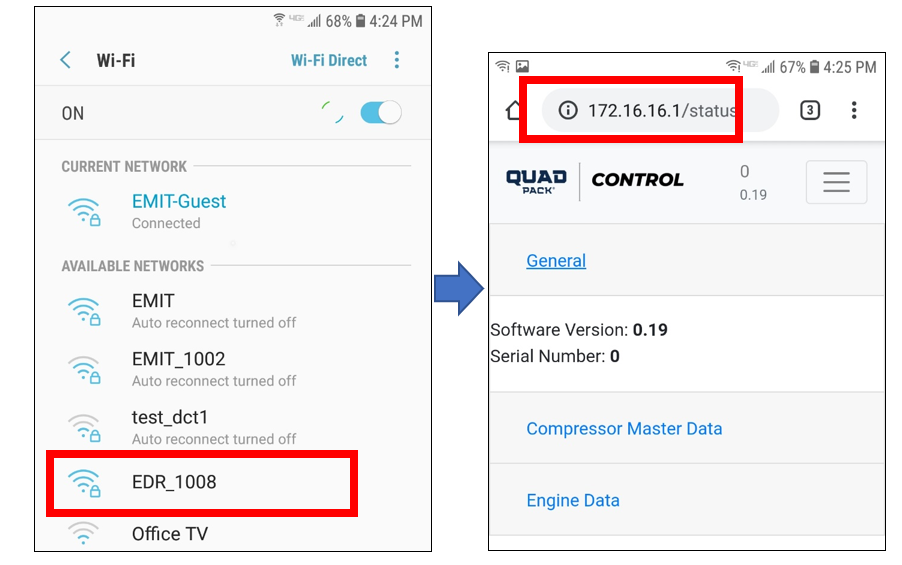
Check your target device’s Wi-Fi settings for a network called “EDR_xxxx”, where xxxx is the serial number of the Data Relay. Connect to this network and enter the password ‘emitemit’.
Note: There will be no internet access while you are connected to the network. It is recommended that you turn auto reconnect off.
Once connected, open a web browser and type http://172.16.16.1/ . This will bring up the Data Relay console.
Wifi Console Pages
From the top right menu on a phone, or along the top on a computer, there will be the following page categories: Status, Compressor Master, Alerts, Engine Data Translator, Modbus Slave, and Debug. Each of these 6 pages are detailed below.
Status
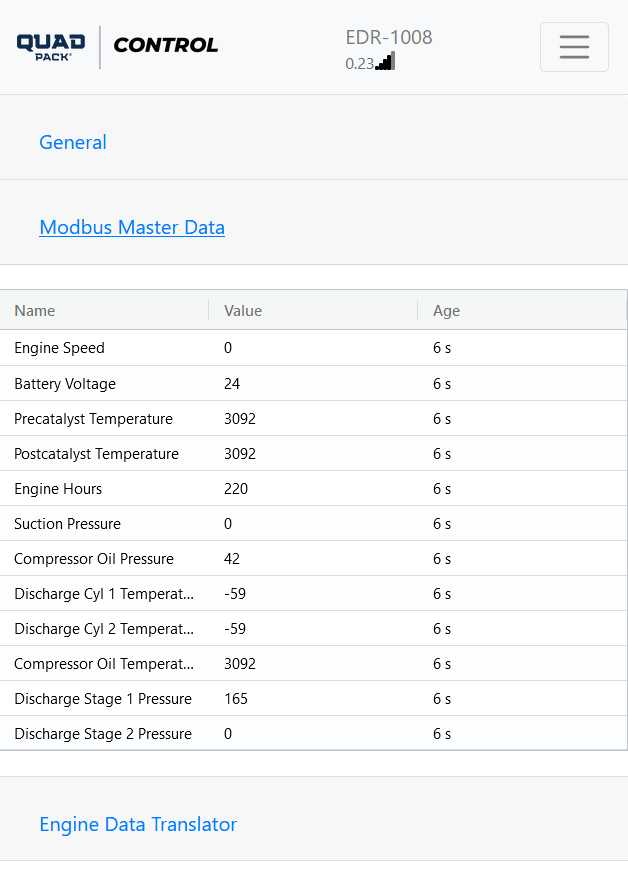
The Status page shows the current readings for engine and compressor data. Settings cannot be edited on this page. Also shown under “General” is the serial number and software version.
The Modbus master data will show the latest values read from the annunciator, and when the value was last read. Normally values are polled every 10 seconds, but this may vary by software version.
The engine data section of General Status will show any collected data from the engine data translator.
Compressor Master
The Compressor Master page is used for viewing and changing information related to the Modbus master table. Sections are:
Modbus Master Table
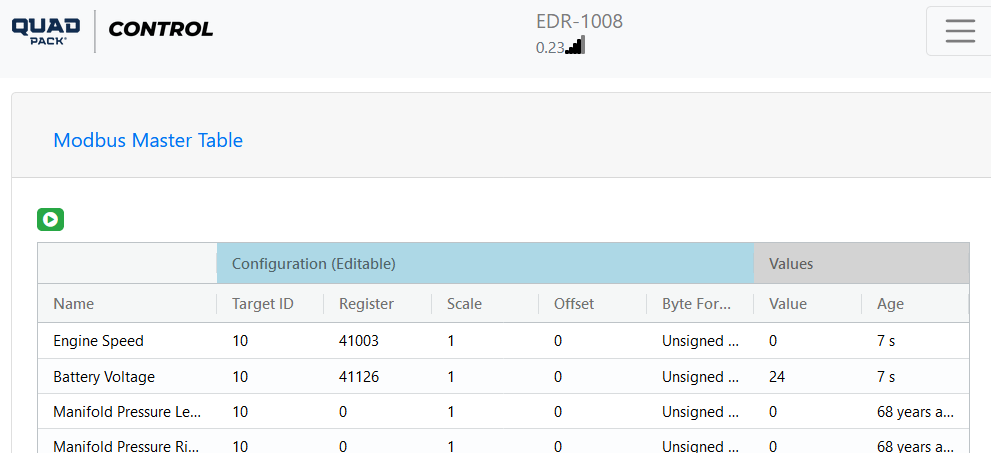
Under this heading is shown the full master table and raw values read.
In the above screenshot, Engine speed is being pulled from Register 41003, ID 10. The value is being read as “0” successfully, because the age is 7s.
Some values will have a ‘Never’ value for the Age because they have not yet been successfully read. In some cases, the value is never even expected because the register is “0”- For example, “Manifold Pressure Right” on a single bank unit will never be seen. If an expected value is missing, it can be debugged from this table.
The table can be edited on this page by selecting a cell and changing the value.
Modbus Master Table File
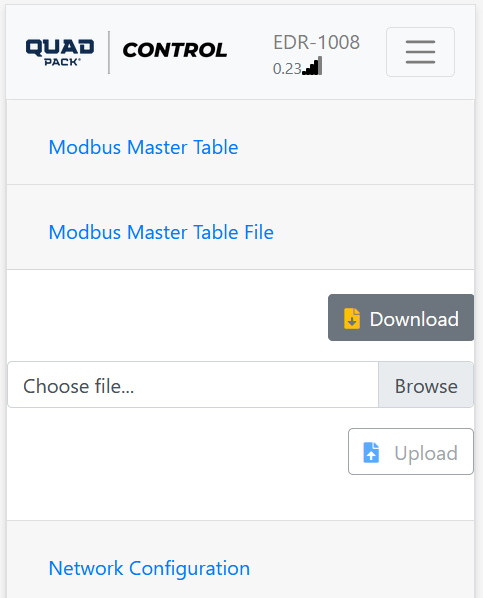
The next heading on this page is “Modbus Master Table File”, where the entire master table can be downloaded or uploaded.
On initial setup, it may be easier to edit the file to get all the registers entered at once rather than edit each row individually over the Wi-Fi console. Also, the download/upload function can be used to use a configuration on another unit.
To download the current file, select “Download”. To upload a new file, select “Browse” then “Upload”.
Network Configuration
The network configuration section is used to setup the RS-485 or Ethernet settings to connect to the slave device(s). Select either Serial or Ethernet by selecting a checkbox, then enter the information to match the settings for the device being targeted.
Network Statistics
The network statistics section shows the number of bytes sent and received. This may be useful for debugging.
Recent Messages
This heading shows the latest message sent and received over RS-485. This may be useful for debugging.
Alerts
Current Run Register
There is a target register and ID that the Data Relay uses to determine the current run status.
The “Current Run Register” heading shows the current reading from that register and how it is decoded using the Run Status Table.
Below the current reading/state, the configuration for the target ID/ register for the run status can be adjusted. Normally this should be set up only once.
Current Fault Register
Like the “Current Run Register”, the Current Fault Register section will show the latest reading from the fault register and how it is interpreted.
In some cases, the fault code register might not have a valid value if the unit is not actually faulted.
The current ID / Register being polled for the fault status can also be edited here if needed.
Run Status Table
The Run Status Table section shows the entire run status table configured. The value/ state type pairs can be adjusted here if needed. When the Data Relay reads the run status register, it will use this table to interpret the current state of the annunciator.
Fault Code Table
Under the Fault Code Table section, the entire fault code table is shown. The table can be edited or expanded here if needed.
Table Configuration Files
Under this section, the fault code table or the run status table can be downloaded / uploaded to the computer for editing in Excel ®. This is often the fastest way to set up the tables on initial setup.
Engine Data Translator
The Engine Data Translator tab has two sections related to the engine data.
Engine Data
This section will show all currently collected engine data. Any valid information seen on the engine data bus will show up here.
Configuration
Under this section, the engine type can be selected.
Modbus Slave
The Modbus Slave tab is used to set up the slave connection of the Data Relay. This is only used if another SCADA needs to pull engine data over Modbus from the Data Relay. This tab has three sections.
Network Configuration
The Network Configuration section is used to configure the serial or IP settings for the Data Relay. The slave ID of the Data Relay itself can also be set here.
Network Statistics
This section shows the bytes sent and received by the RS-485 slave port. This information may be useful for debugging.
Modbus Table
This section has a link to download the Modbus slave table. This table is the same for all devices.
Debug
The Debug tab has three sections related to the connection to EMIT Data Services and Debugging.
Device Config
This section shows the cellular config of the device.
The “Service Level” will show 2 or higher if the unit is activated to send remote data to EMIT. The activation is done by calling 307-673-0883 and asking for “Telematics Activation” or emailing [[1]] with the board serial number, and the activation is sent over the air. The Unit Number is also pulled from the remote server and can be configured in the portal at https://data.emittechnologies.com/ .
The “Sync Telematics Config” button is not often used but may be requested by EMIT Tech support. The button will ping the server for the latest service level and Unit. If the Unit number is not correct, try this button.
The “Send Test Callout” button can be used to send a test callout to the current callout targets for the unit.
Connection Information
The connection information section shows current Cell connection info. If there is no signal strength or carrier shown here, check the antenna connections. In some cases, a higher antenna may be needed.
Software Update
The software update section is used to upload a software update. Select “Browse” to select a file, then “Update” to start an update. The update process will take about a minute. Software updates will have a file name “EDR_update[…].emt” where the […] varies.


