DCT Datalogs
Overview
The DCT has several types of built-in datalogs that are always running:
- Normal sensor data, logged for all sensors every 1 minute. Rolls over at about 30 days.
- Shutdown logs, logged for all sensors every 1 second for the previous minute. The last 10 of these logs are saved.
- Alarm logs, logged for all sensors every 1 second for the previous minute. These are deleted when an alarm is cleared.
Long-term Sensor Datalogs
All of the sensors on a given module are logged at all times at 1 minute intervals and stored on the DCT's internal memory. These logs can be viewed from the Datalog View page and downloaded or deleted from the Datalog Files page. The files store around one month of data and automatically roll over. Each module (brain, ignition, etc.) is stored in a separate file.
Viewing Datalogs
The main datalogs can be viewed by selecting the "Datalogs" button on the home page.
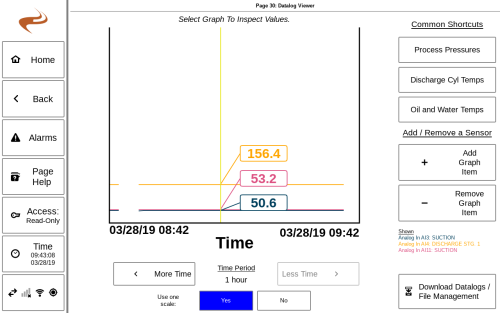
To graph any sensor, select "Add Graph Item", which brings up a list of all sensors that can be graphed. Select one to add it to the graph. The current sensors graphed are shown in the bottom right. The "Common Shortcuts" on the top right will automatically graph some common items when selected.
The graph itself can be selected to add a cursor that shows the exact value of the datalines at that point in time, as seen on the screenshot above. The time period for the graph can be increased or decreased using the buttons below the graph.
The "Use one scale" button on the bottom toggles whether all the datalines are graphed together or separately. Using one scale makes it easier to compare values, but may not make good use of the vertical space. Turning it off allows each line to be graphed independently, which makes seeing trends easier but removes the ability to directly compare sensor values against one another.
Downloading Datalogs
All datalogs can be downloaded or deleted at the Datalog File Management page. This page is reached by selecting "Download Datalogs / File Management" on the Datalog display page. Insert a USB drive and select “Download All” to download all logs to the disk to be viewed on a computer. The "Delete" button can be used to clear out the logs and the DCT will start with empty files.
Shutdown Logs
On both the EIM and DCT there are logs stored of the past 10 times the unit went from running to stopped. These logs are called the previous shutdown logs, and contain a log of every sensor on the system in the last minute before shutdown, and one sample per second. Note that a log is created when the rpm goes to low for any reason, even if there was not a fault. These logs can be viewed on the screen or downloaded.
The shutdown logs are useful for:
- If an alarm was cleared (which deletes the normal alarm sensor file) but later it is still desired to look at the sensor data of the minute before the shutdown. Since the last 10 shutdown logs are always retained, the event data can still be viewed after the alarm is cleared.
- If the engine was shut down with a normal stop but the data leading up to shutdown still is desired.
Viewing the Shutdown Logs
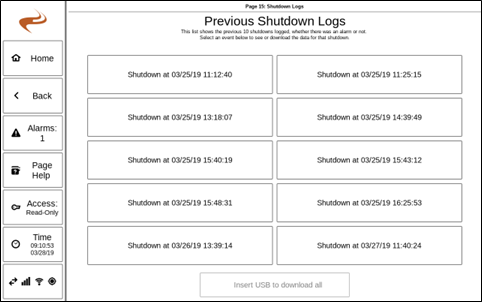
On either the EIM or DCT, go to the 'Alarms' button, then "Past shutdown logs". This will show the page below.
Past shutdown logs list on the DCT
Select one of the logs to view a graph of a sensor, and select the graph to view another sensor.
Downloading the Shutdown Logs
After inserting a USB drive in the back of the screen, select the button on the bottom of the shutdown logs page and all ten files will be copied to the drive.

