Unit Reports: Difference between revisions
No edit summary |
|||
| Line 1: | Line 1: | ||
== Overview == | == Overview == | ||
Unit runtime reports can be downloaded via the online Connect portal or can be configured to be emailed on a daily basis. These reports summarize uptime, downtime, and list fault events. | There are two types of reports: single-unit reports and multi-unit reports. Single-Unit runtime reports can be downloaded via the online Connect portal or can be configured to be emailed on a daily basis. These reports summarize uptime, downtime, and list fault events. Multi-Unit reports are similar but show a summary for many units covering one area or customer. | ||
== Downloading Reports via the Portal== | == Downloading Reports via the Portal== | ||
| Line 66: | Line 66: | ||
===Tab 5- Summary Chart=== | ===Tab 5- Summary Chart=== | ||
This tab simply shows a pie chart of the shutdown times from the "Down Time Summary" in tab 1. | This tab simply shows a pie chart of the shutdown times from the "Down Time Summary" in tab 1. | ||
==Multi-Unit Reports== | |||
To download a multi-unit report, go to the "Reports" section along the top of the Portal, then use the top section to select the type (area or customer) and time range. Afterwards, the report can be downloaded as one file. | |||
The multi-unit reports will show downtime categorized by mechanical or production. See [[Portal_Overview#Alerts_Tab]] for the source of this information. | |||
Revision as of 21:23, 13 September 2023
Overview
There are two types of reports: single-unit reports and multi-unit reports. Single-Unit runtime reports can be downloaded via the online Connect portal or can be configured to be emailed on a daily basis. These reports summarize uptime, downtime, and list fault events. Multi-Unit reports are similar but show a summary for many units covering one area or customer.
Downloading Reports via the Portal
- Navigate to https://data.emittechnologies.com
- Log in using your company credentials
- Select a unit.
- Click 'Reports' tab
- Input date range
- Click 'Download Runtime Report
Daily Emails
Daily runtime email reports can also be configured. The reports are sent at 6:00 AM Mountain Time every day.
To schedule the report, on the Reports tab of a unit enter a new email address under the "Scheduled Reports" box then select Add.
Single-Unit Report Contents
The downloaded Excel report will have 5 tabs. The summary information is on tab 1, with some more detailed information on the other tabs.
Tab 1- Summary
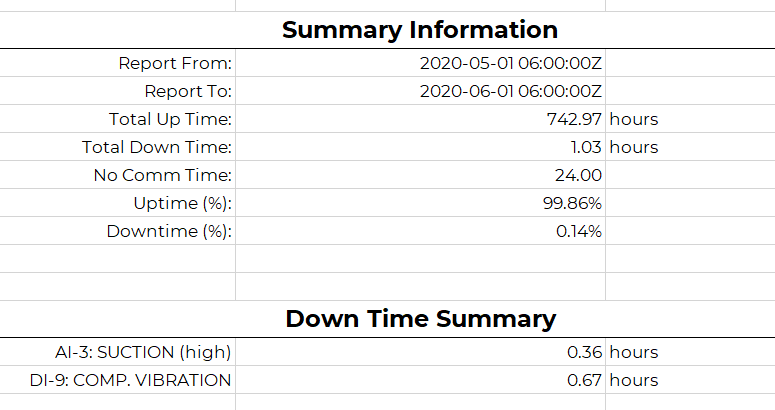
The summary tab shows basic unit information allowing with time summaries. The time summary shows the uptime, downtime, and no comm time for the month. No comm time is the amount of time the panel was not communicating, and this time is not counted in the percentages.
Under the time summary is the Down Time summary. It lists the down time for each cause.
Tab 2- Shutdown Events
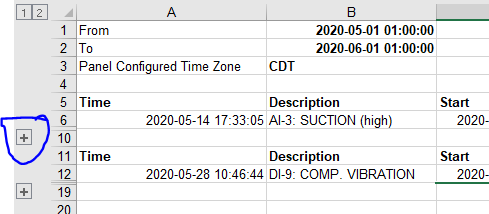
The shutdown events tab shows the grouped downtime events. When a unit goes down, its first fault is considered the cause of the downtime. If the unit is up and down for several short periods after this, it is lumped into the original cause. The + symbol to the left of an event can be clicked to expand the group of events that were lumped together.
Almost always when there is a "Shutdown" (fault kill) there is a "Stop" around the same time, since a "Stop" catches any event where the unit goes from running to stopped. If an event is "Stop" only then it was probably a manual stop.
Tab 3- All Alerts
The third tab shows all alerts from the unit. This is the raw information that was used to create the grouped-together information on tab 2.
Different "Type" of events are the following:
- "Start": Unit reported that it has started running
- "Stop": Unit reported that it has stopped running (RPM went low)
- "Shutdown": Unit reported that the annunciator faulted. Almost always there will be a Stop around the same time.
- "Start_Hidden", "Stop_Hidden", "Shutdown_Hidden": These are the same as Start/Stop/Shutdown except the panel was requesting that a notification (call/text) should not be sent out. Usually this is because the unit was only running a very short amount of time and someone was at the panel so texting everyone would have been pointless. Sometimes it can also be because callouts were turned off at the panel under Telematics Settings.
- "UnknownStart", "UnknownStop": These events show when the reported RPM from the panel went to running or stopped but no alert event was received from the panel. This can happen when the event message was somehow lost. Usually the report will start with an UnkownStart if the unit started the month as running but the actual start event was sometime in the past, which is normal.
Tab 4- Engine Speed
This tab lists the raw engine speeds from the report time period. Normally the panel should be reporting every 15 minutes unless it is shut off. If there are gaps in the data, it is reported as the "no comm time" in the first tab.
Tab 5- Summary Chart
This tab simply shows a pie chart of the shutdown times from the "Down Time Summary" in tab 1.
Multi-Unit Reports
To download a multi-unit report, go to the "Reports" section along the top of the Portal, then use the top section to select the type (area or customer) and time range. Afterwards, the report can be downloaded as one file.
The multi-unit reports will show downtime categorized by mechanical or production. See Portal_Overview#Alerts_Tab for the source of this information.


