DCT Information Pages
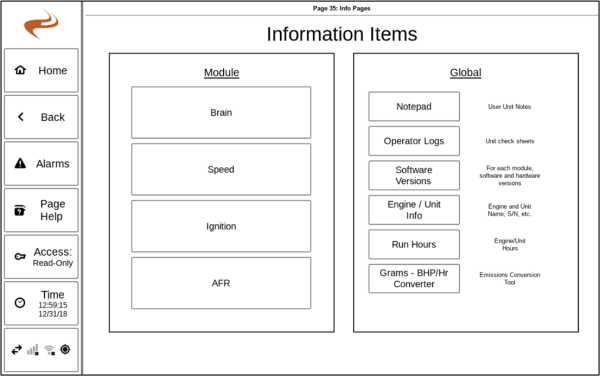
The ‘Information’ button on the home page can be selected to go to the Information Menu, which links to some global and module-specific information items.
For each of the modules (Brain, Speed, Ignition, AFR) selecting that item goes to a sub-menu (if applicable) of information items for that module. These module information menus are discussed in the appropriate module section of this document. The global items are listed below.
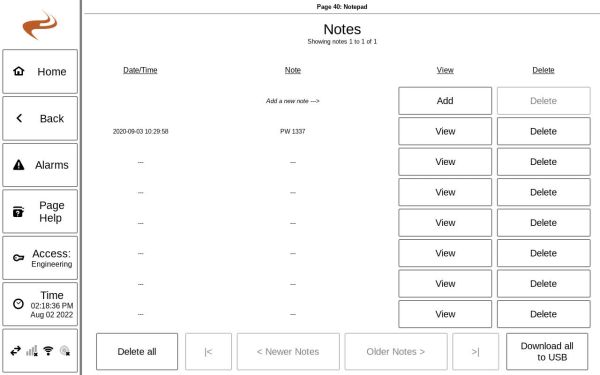
Notepad
The notepad page is used to add user notes for the unit. Notes that might be helpful are emissions testing results, unit adjustments, maintenance events, etc. To add a note, select ‘Add’ and type a note. The notes can be downloaded when a USB drive is inserted and the screen is in ‘Engineering’ access level.
Operator Logs
The ‘Operator Logs’ section of the touchscreen can be used to store unit check sheets. When a log event is added, the unit will save for that date/time:
- Name of person performing check
- All enabled analog input levels, alarm limits, and time of last alarm change
- All enabled thermocouples, alarm limits, and time of last alarm change
- Unit hours
- Engine Speed
- Other custom fields, if needed
The set of all logs can then be downloaded as needed.
Configuring operator logs
To configure the logs, select ‘Information’ -> ‘Operator Logs’ -> ‘Setup Log Content’. Most items the logs capture are built in, but custom items can be added to this list.
Adding log event
To add a log, the person performing the check will navigate to ‘Information’ -> ‘Operator Logs’ -> ‘Add…’. This will lead to a wizard that will go through the steps below.
Step 1: The technician will enter their name and verify the time, unit number / name, RPM, and hours.
Step 2: The technician will verify the current analog input readings and alarms
Step 3: The technician will verify the current thermocouple input readings and alarms. The screen appears very similar to the step 2 screen.
Step 4: The technician will enter any of the custom fields that were set up for that unit.
Step 5: Select ‘Submit’ to save.
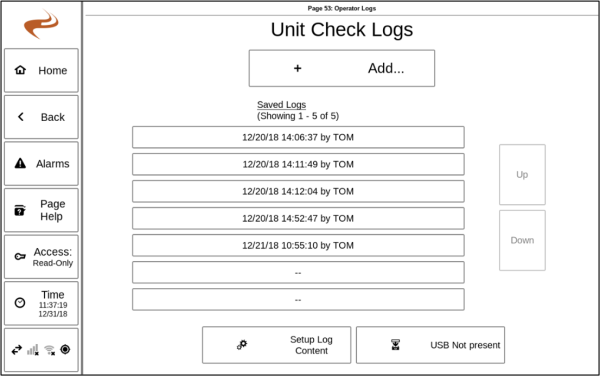
Previously submitted logs will be displayed on the unit check log landing page, shown below.
Viewing Logs
From the unit check logs menu, select a log event to see the data from that log event. Use the scroll bar on the right to view the entire log.
Downloading Logs
The list of logged events can be downloaded to view on a computer. There are two options for downloading a log:
- Text Files: Save each log event as an individual text file. All the files will be copied to the drive, one per event.
- Single Table: Save a table of all the logged events, to view in Excel® or similar program. Each row is an individual event.
Software Versions
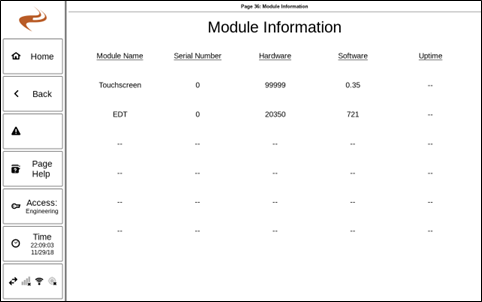
This page shows the software version and serial number of attached modules (including the DCT and the internal data translator). The page can be used to verify that software updates have been completed.
Note that the EDT (Data Translator) is built into the touchscreen but will show up as a separate row in this table since it can be updated separately.
Engine / Unit Info
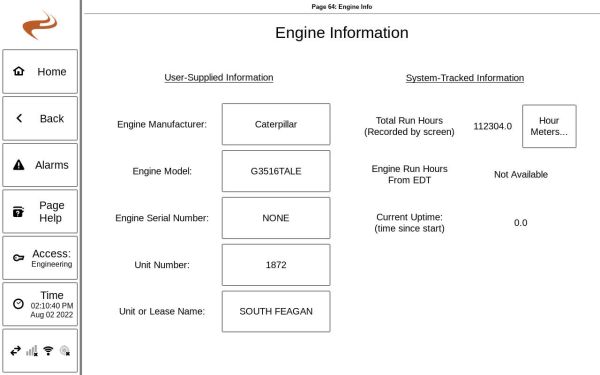
This page is used to enter the engine make/model/serial number, the unit number, and the unit or lease name. This information is appended to some logs for convenience. The unit and engine hours are also shown.
Run Hours
Grams - BHP/Hr Converter
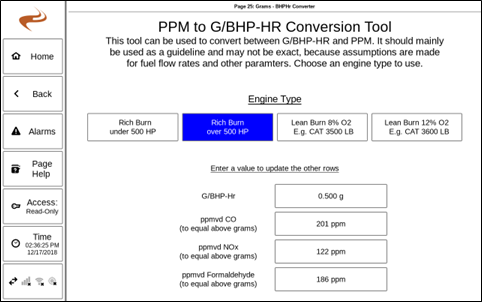
This is a convenience tool for converting ppm of some pollutants to grams per brake horsepower hour. To use, select the engine type then enter an item in one of the four boxes to fill in the remaining boxes with the calculated values to match.
