Annunciator Main User Interface Overview
GENERAL OVERVIEW
The annunciator has two normal sources of user input- the EIM display and the panel switches. The general operating states and how the panel switches affect the state are as follows.
With the Annunciator in the "Stopped" state, pressing the panel RESET button will reset the annunciator. This will cause the annunciator to go to the "Run" state, or move to Pre-Lube or other startup states as needed. If not in the stopped state, pressing RESET will only restart the B timers. Any “A” input faults will cause the annunciator to immediately stop and return to “Faulted” state. If using autostart or an ECU with autostart, after any pre/post lube or other startup conditions are met the annunciator will display “Ready to Start”.
Pressing the panel STOP button will always cause the annunciator to go to the "Stopped" state.
If autostart is used, then pressing the panel START button will begin the auto start process. This can be done if in the "Stopped" state or after pressing RESET, but all A contacts have to be clear for autostart to begin. Pressing START will always reset the B timers. If RESET is pressed to start Prelube, then pressing START before prelube is complete will cause the engine to start automatically when prelube is finished.
If autostart is not used then holding the START button will run the starter, if the annunciator is in a run state.
The next section covers some of the main screens of the annunciator. If the user is not familiar with the basics of the EIM, the user guide for the EIM should be reviewed first.
ANNUNCIATOR HOME SCREEN
The Annunciator Home screen (Pg. 600) shows an overview of the system status and the readings of some select sensors.
Annunciator Home Screen
RUN STATUS
The left side of the annunciator home screen is the “Run Status” box. The area in the center of this region will show the current run state of the annunciator- running, stopped, or another state. It will also show the status of B timers, if running, the status of the Pre/Post lube output, if used, and the engine runtime hours.
On the bottom of the run status box is a “Reset” and “Stop” button. Selecting either will do the same action as the corresponding panel switch.
Selecting the run status box itself will navigate to the Annunciator Inputs and Timers Status screen (Pg. 610).
GAUGES
The right side of the annunciator home screen contains a set of gauges. Six gauges can be shown at once, but up to five sets of gauges can be configured. If more than one set is available, a “Next” and/or “Prev” button will appear at the top of the gauge area to cycle through available sets. The gauges shown can be changed in the Gauge Selection Screen (Pg. 632), described later.
Each gauge shows the name of the input at the bottom and the current reading of the input in the center. If configured, warning bars will be shown on the top and/or bottom and will be colored red for shutdown inputs, yellow for warning inputs, and gray for no-action inputs. If an input is currently faulted, the gauge will be lit up with the same color. Selecting a gauge will navigate to the Individual Input Statistics (Pg. 660) for that input.
At the bottom of the gauge area are two buttons- “Help” for an overview of the page, and “Annunciator Setup” for a link to the annunciator setup pages.
ANNUNCIATOR INPUTS AND TIMERS STATUS
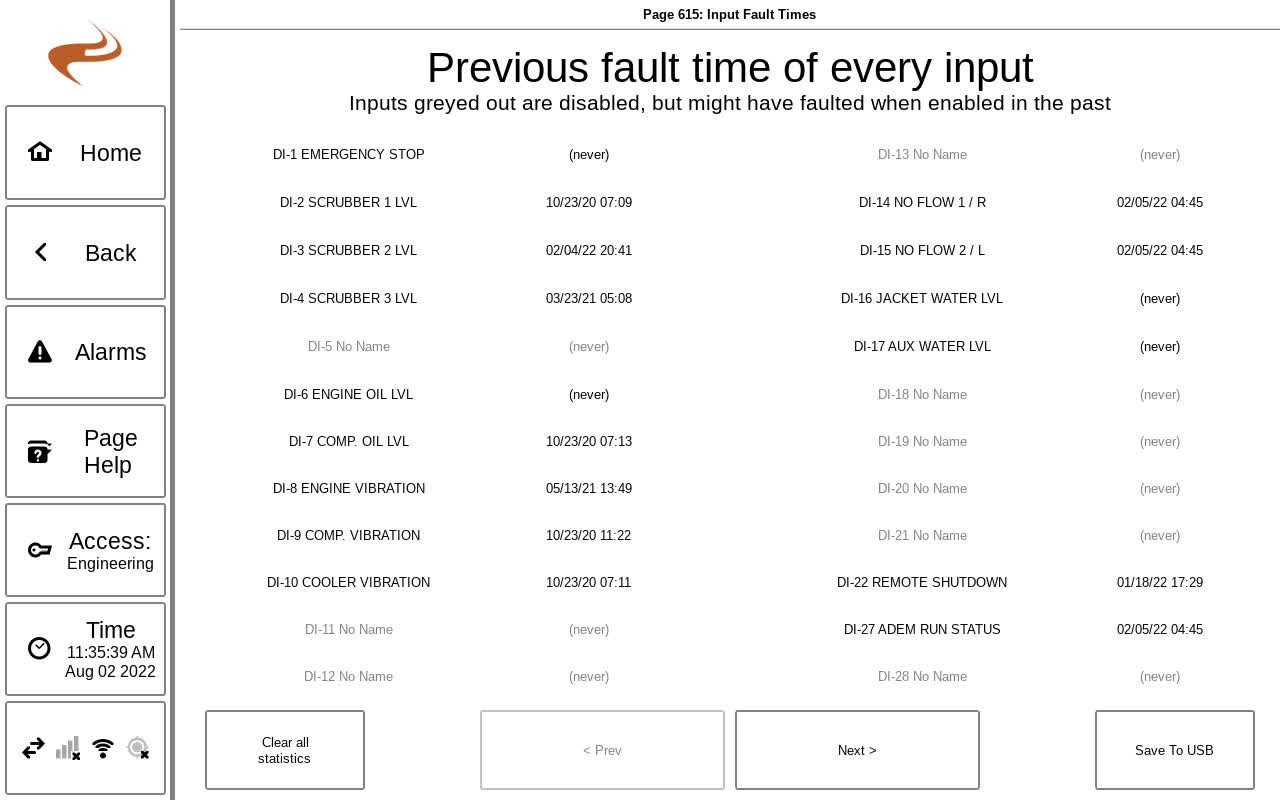
Selecting the run status box from the Annunciator Home screen navigates to the Annunciator Inputs and Timers Status (Pg. 610). This screen is different on newer versions of the EIM.
Annunciator Faults/Outputs Status Screen (New Version)
The left side of the screen can be selected to view different status options. For more information, see the next article.
INDIVIDUAL INPUT STATUS/STATISTICS
Selecting a gauge on the Annunciator Home screen will navigate to the Individual Input Statistics screen (Pg. 660) for that input. This page can also be accessed from “Annunciator Setup” -> “Input Status” for inputs that do not have a gauge configured.
Individual input statistics and status
The left side of the screen shows the shutdown and datalog statistics for the input. The top portion shows the last shutdown, total shutdown, and percentage of total shutdowns that were this input. The bottom portion shows the 24 hour average, min, and max of the input.
The right side of the screen shows the previous minute of sensor data, graphed in real time. If an alarm or warning limit is configured, shaded bars will be shown for the limits.
The bottom of the screen has links to go to the Datalog View (Pg. 75) screen with that input selected, to see sensor data for a longer period (up to one month). The other button goes to the individual sensor setup page for that input, with the target page dependent on sensor type.

