Annunciator Main User Interface Overview
General Overview
The annunciator/Brain has two normal sources of user input- the panel display and the panel switches. The general operating states and how the panel switches affect the state are as follows.
With the Annunciator in the "Stopped" state, pressing the panel RESET button will reset the annunciator. Usually this causes the system to enter the "Standby" state. If set up as a basic engine, RESET will cause the annunciator to go to the "Run" state, or move to Pre-Lube or other startup states as needed. If not in the stopped state, pressing RESET will only restart the B timers. Any “A” input faults will cause the annunciator to immediately stop and return to “Faulted” state.
Pressing the panel STOP button will always cause the annunciator to go to the "Stopped" state.
If autostart or an engine ECU with crank control is used, then after in Standby pressing the panel START button will begin the auto start process. All A contacts have to be clear for autostart to begin.
If autostart is not used then holding the START button will run the starter, if the annunciator is in a run state.
The next section covers some of the main screens of the annunciator.
Home Slides
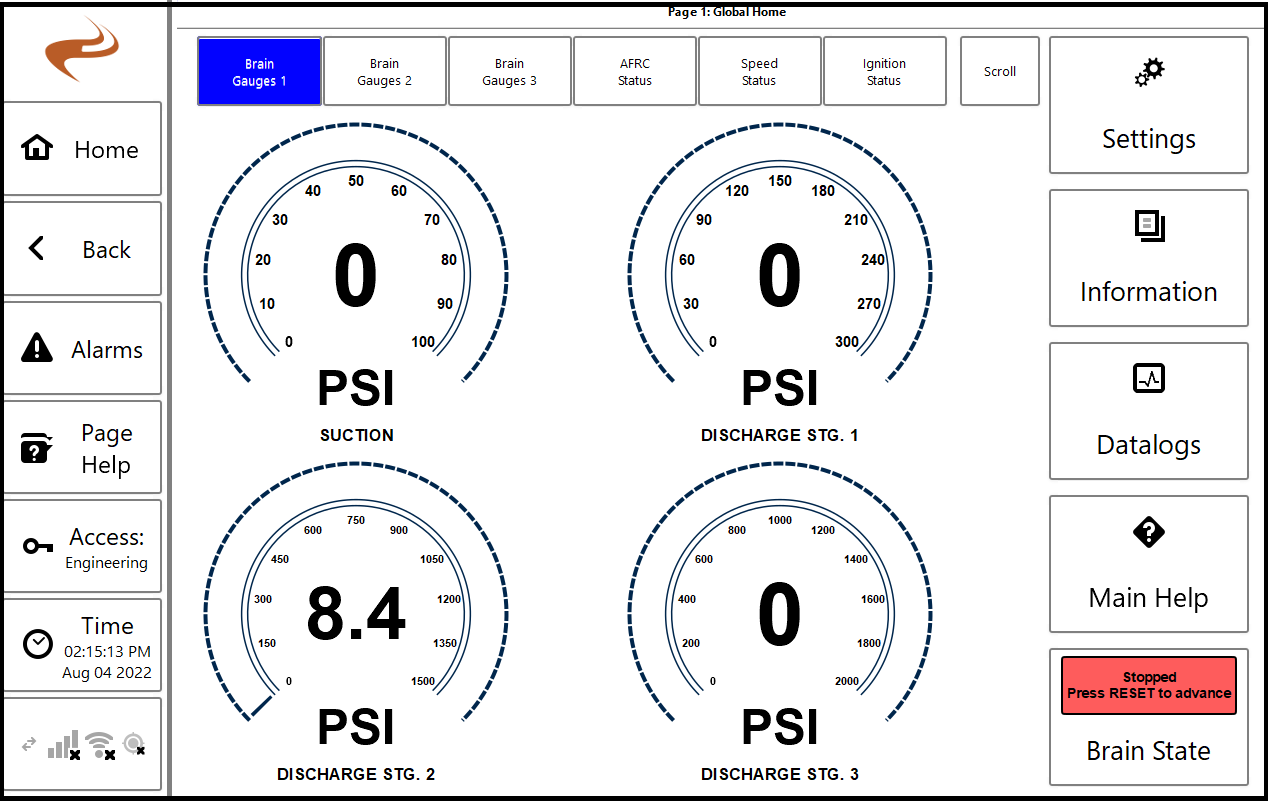
The home page of the DCT will show some number of Brain (core) status slides showing various gauges. The state will also be shown in the lower-right.
Gauges
There can be up to 5 slides of gauges for the Brain. At most 9 inputs can be shown on each page, and if 4 or less are used then the gauges will be bigger. The gauges shown can be changed in the Gauge Selection Screen, see Annunciator Setup - Home Page Gauges .
Each gauge shows the name of the input at the bottom and the current reading of the input in the center. If configured, warning bars will be shown on the top and/or bottom and will be colored red for shutdown inputs, yellow for warning inputs, and gray for no-action inputs. Selecting a gauge will navigate to the Individual Input Statistics for that input.
Individual Input Status / Statistics
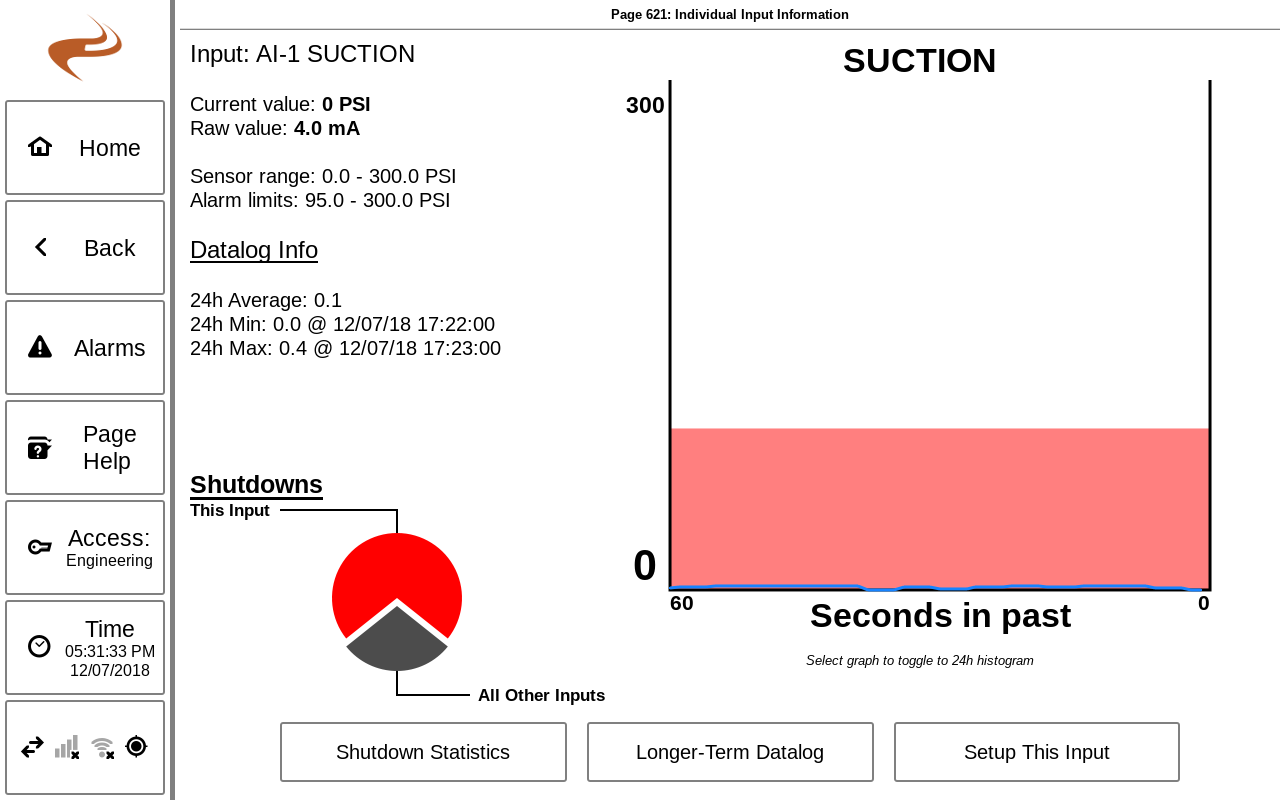
Selecting a gauge on the Brain Home screen will navigate to the Individual Input Statistics screen for that input. This page can also be accessed from “Annunciator Setup” -> “Input Status” for inputs that do not have a gauge configured.
Individual input statistics and status
The left side of the screen shows the shutdown and datalog statistics for the input. The top portion shows the last shutdown, total shutdown, and percentage of total shutdowns that were this input. The bottom portion shows the 24 hour average, min, and max of the input.
The right side of the screen shows the previous minute of sensor data, graphed in real time. If an alarm or warning limit is configured, shaded bars will be shown for the limits.
The bottom of the screen has links to go to the Datalog View screen with that input selected, to see sensor data for a longer period (up to one month). The other button goes to the individual sensor setup page for that input, with the target page dependent on sensor type.
Run Status
The bottom-right button of the home page shows the current Brain state (stopped, running, etc.). This button can be pressed to go to the general Brain status page.

