Portal Overview
Video for this topic: https://www.youtube.com/watch?v=bHbOUCUIvc4
The telematics site at [data.emittechnologies.com] can be used to manage and view information related to Dynamic Control Panel telematics services, such as view recent unit data and alerts, change callout targets and schedules, change unit names and information, and download reports. Each will be detailed in this article.
Logging In
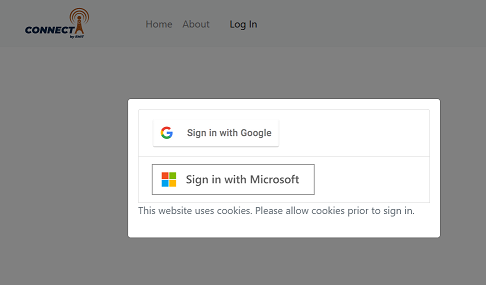
Initially, the above screen will be displayed and you can select one of the two sign in options. Select the option which your organization uses for account management (Microsoft is more common).
This will take you to the Microsoft or Google login page, where you will use your normal address and password that you use for email. EMIT does not store account credentials - Microsoft or Google will tell us that your account is valid.
Home Page
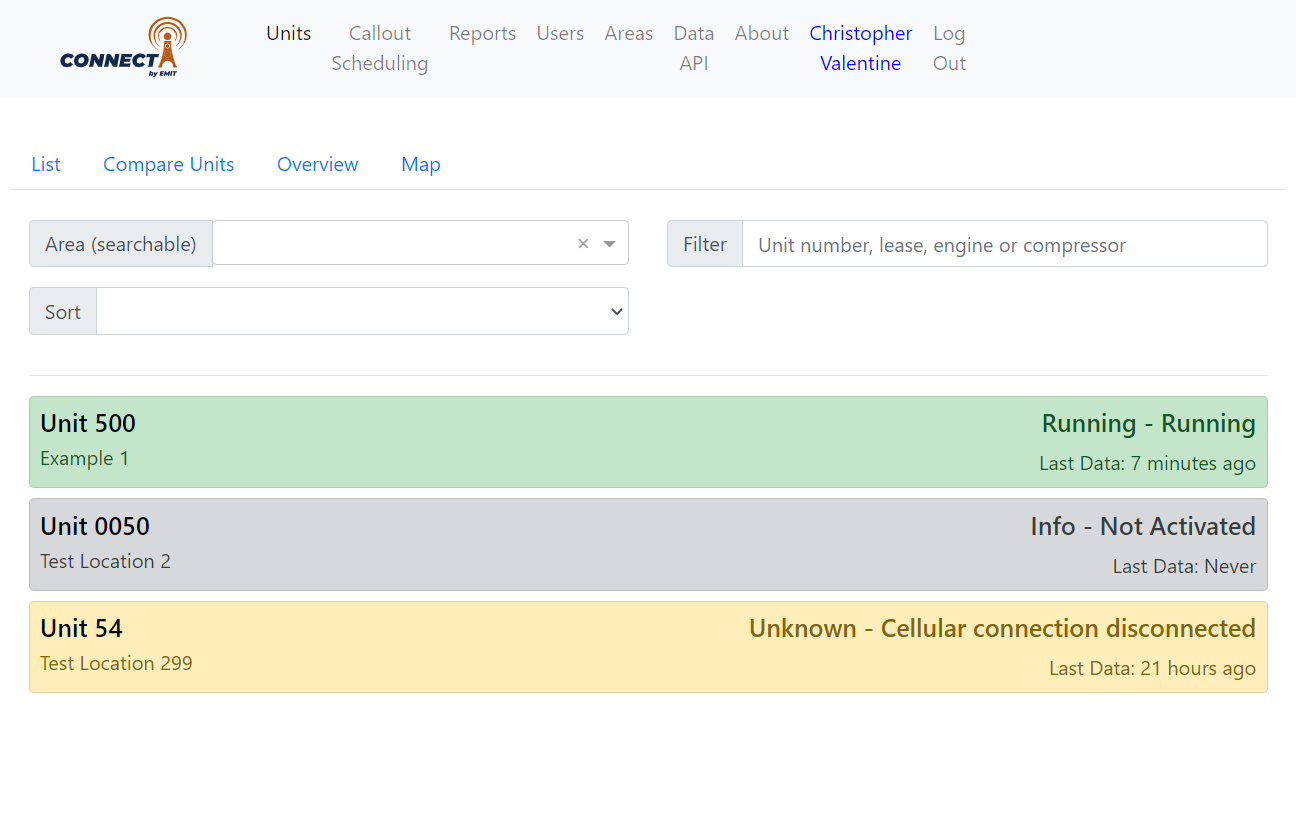
Once you are logged in, the default starting page is the Units page, which can also be reached later by selecting the "Units" tab along the top.
The other tabs along the top will be used to go to other sections of the site.
Units Page
The Units page has four tabs - List, Compare Units, Overview, and Map. The 'List' will list all the units. Note that the area dropdown directly under "Filtering" can be used to filter to only units in one area.
The Compare Units page will show the most recent data for each unit in a tabular format, enabling comparison of values from one unit to another.
The overview page will show recent alerts, Issues, and configuration changes for all units.
The Map page will show a map of units in the current area.
In the list page, any unit name can be selected to go to a particular unit, such as "Unit 0002" in the above example. The units will be colored according to the current status, and a note will show when data was last received.
At the top of the page the 'filter' box can be used to find a unit by typing in the unit number or lease name.
Individual Unit Page
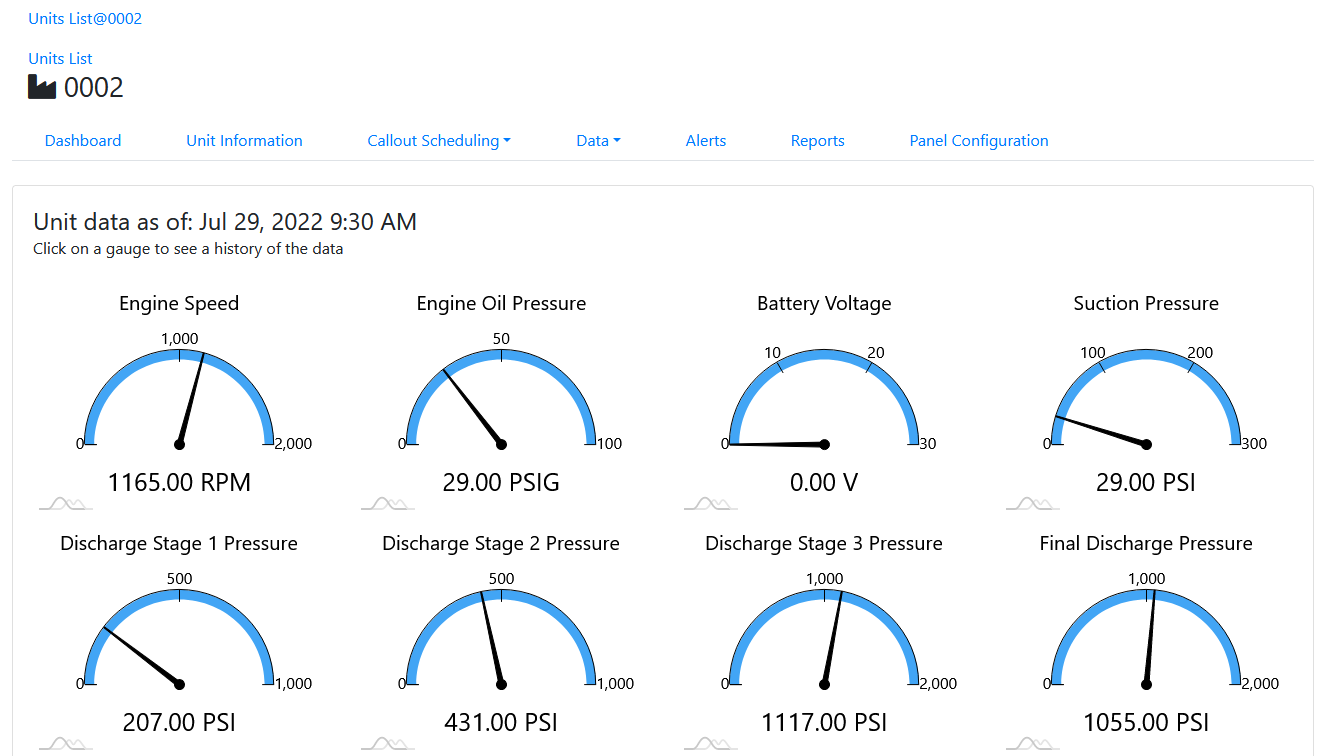
Selecting a unit name on the unit list will bring up the individual unit page. Along the top are 7 tabs for information related to this one unit.
Individual Unit Home
The first tab some latest sensor data received from the unit. Not all data values are necessarily shown. A gauge can be selected to view a data graph, which is also discussed later.
Unit Information
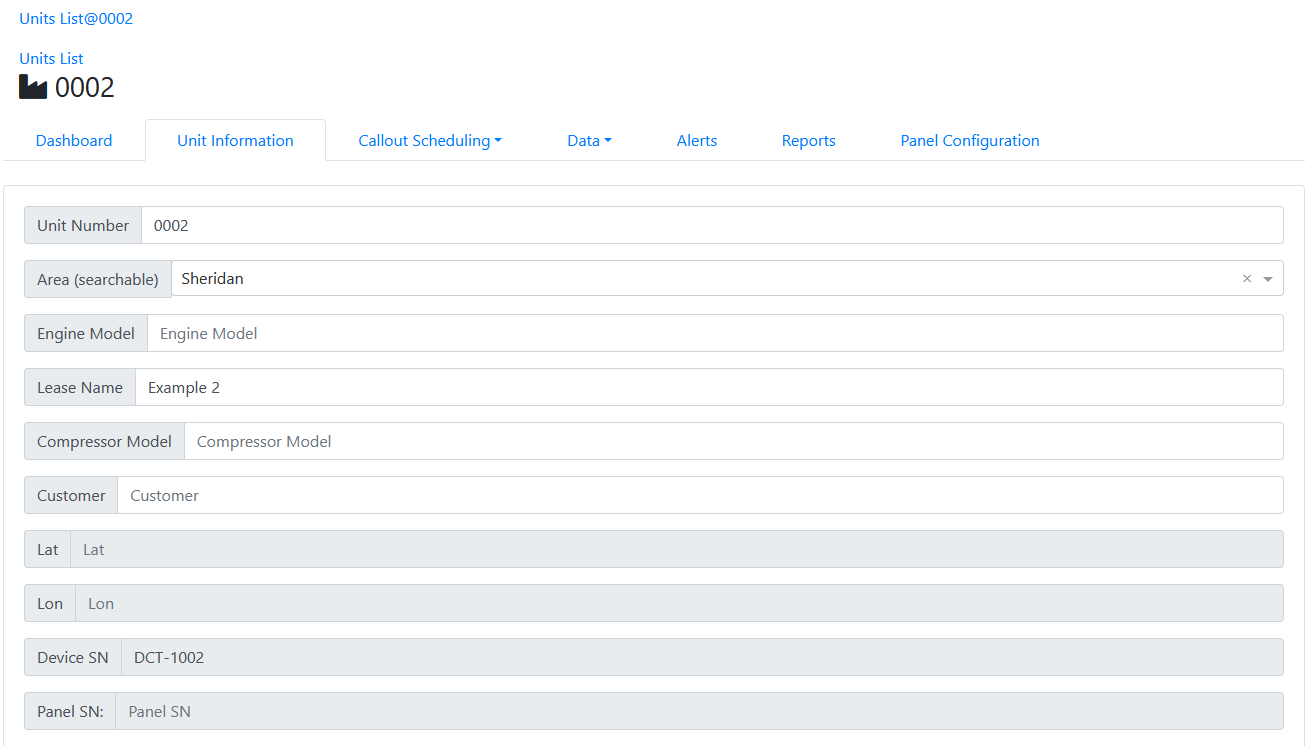
The second tab shown above lists basic unit info. The info here can be changed by typing into the boxes and selecting 'Save' at the bottom. This is useful, for example, when a lease name changes.
Callout Scheduling Tab
The callout scheduling tab is used to see the list of callout targets from the panel, or a configured schedule. Selecting 'Calendar' on this page will show the full schedule.
The "Callout targets" bullet point shows contacts that were entered on the panel and are always active.
If you are not sure how to create schedules, go to "Callout Scheduling" at the very top of the site, and selet "Tour". This will go through concepts related to scheduling. In this section of the site Contacts and Groups can be edited as well. A group can be created with its own schedule, then assigned to different units so that the schedule on each unit doesn't have to be manged, only the group schedule.
Data Tab
The data tab has three options - Chart, values, and export.
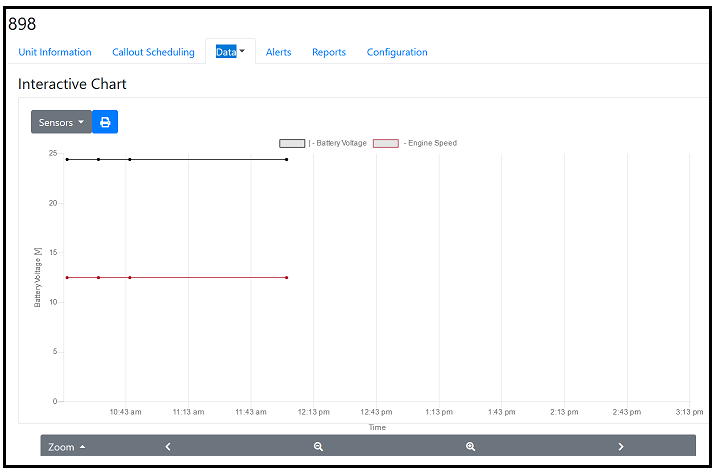
Select 'Chart' to plot some recent data points.
The 'Zoom' button on the bottom is used to set the time scale, then the 'sensors' dropdown is used to add or remove sensors. Data is normally collected every 15 minutes. All potential sensors are displayed, but only some will be actually collected on each unit - for example, if there is not an AFRC then the DPV data will be empty.
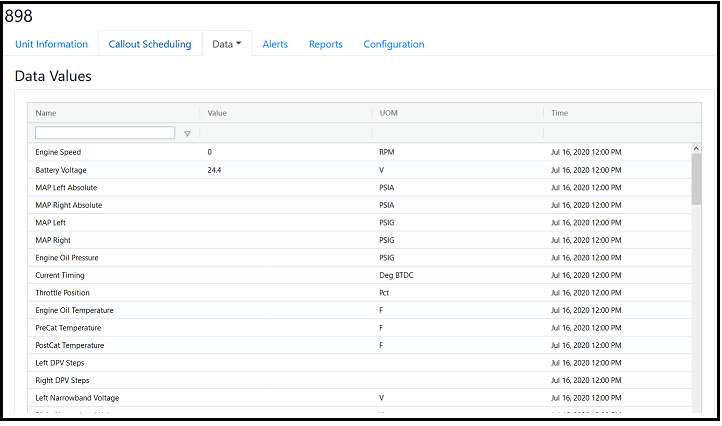
The Data -> Values dropdown brings up a list of recent data, with newest data first.
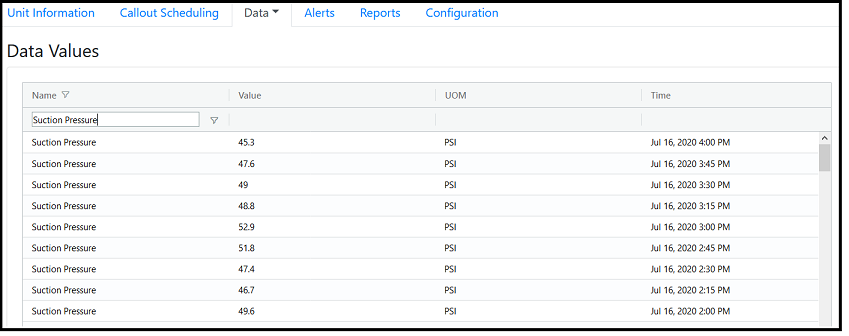
The filter box just under 'Name' can be used to filter one type of information, for example if you type in "Engine Speed" into the box the then recent speed values for the unit will be shown.
Filter example- "Suction Pressure" typed into the filter box to see recent suction pressures.
Alerts Tab
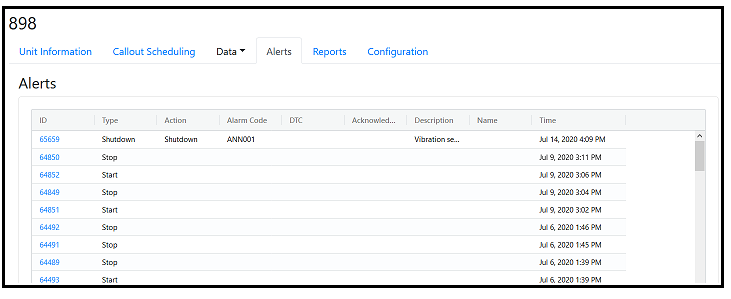
The alerts tab shows a list of recent alerts. Selecting an alert will bring up some more details about that event.
Reports Tab
The reports tab allows for creating unit reports. A runtime report can be created by specifying a range and downloading the report. Under "Scheduled Reports" on the second part of the page, a list of contacts can be added to get daily reports of data, runtime, or alerts. These will be sent automatically via email each morning. These email addresses can include persons outside the normal organization, such as a customer.
Configuration
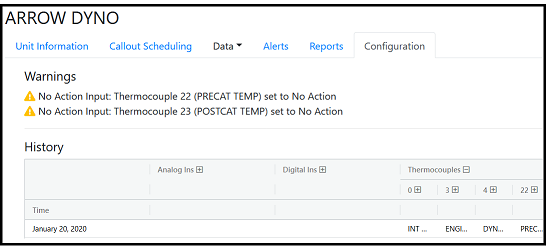
The configuration tab shows recent configuration changes, and warnings around configuration problems (such as rolled out kills). Units with configuration warnings will also be noted on the main unit list, and this tab is where the detail is seen. These warnings can help identify potentially critical issues that can be prevented with proper alarms.
Callout Scheduling Section
Users Section
The Users section of the site is used to set up Guests and Associates for a company.
- Guests are external users who can log in and see data on specific units, but cannot edit anything on those units. This is commonly used for customer access to data on a few units. See Guest Access
- Associates are external users who can log in and see everything a normal company user can see. This type of user is not commonly used!
Areas Section
The Areas section of the site is used to view, edit, and add areas for a company. Existing areas can be edited to add a description by clicking the 'Edit' button to the right of an area. New areas can be added
To Add a new area, enter a name (such as "12") and a description of the area (such as "Midland North"), then select the Add button.
Note: If the top of the page does not say "Add area", try going to another tab and back to the Areas tab.
